3 diena
Taigi, saga tęsiasi… Atėjo laikas dar kartą aplankyti Manitou. Ši mašina atimdavo vis daugiau laiko, o tuo metu rezultatų turėjome nedaug. Trumpai priminsiu, ką sužinojome ankstesnių apsilankymų metu:
Žinojome, kad siurblys prieš vožtuvų bloką gali sukurti 250 bar slėgį esant 70 l/min srautui. Gedimą buvome užfiksavę ir manėme, kad problema susijusi su srautu. Slėgis, susidarantis dėl pasipriešinimo srautui, taip pat buvo kur kas mažesnis nei žinomai tvarkingos mašinos. Norėdami aplenkti problemą, įsigijome išleidimo sekciją (outlet slice) su slėgio ribojimo vožtuvu, kuris nustato mašinos darbinį slėgį. Taip pat žinojome, kad pagrindinė šios mašinos problema yra srautas ir kad nustatyti, kur dingsta alyva, bus nelengva užduotis.
Srautmačio įmontavimas į bako liniją, nuo vožtuvų bloko iki bako kolektoriaus, atrodė geras planas, nes taip pamatytume alyvą, ištekančią iš vožtuvų bloko. Žinojome, kad siurblys į vožtuvų bloką gali paduoti bent 70 l/min, tačiau jeigu atgal negrįžta 70 l/min, vadinasi, alyva keliauja kažkur kitur. Srautmatį įmontuoti niekada nėra lengva, bet jautėme, kad to reikia, jog turėtume kryptį.
Mašiną įšildėme ir variklio sūkius nustatėme apie 1400–1500 RPM, kaip ir ankstesniame teste. Sistemai esant neutralioje padėtyje matėme, kad ties siurbliu yra 29,57 bar slėgis, o LS (apkrovos jutimo) grandinėje – 3,3 bar. Tačiau svarbiau tai, kad per srautmatį tekėjo 74 l/min alyvos. Pažvelgę į hidraulinę schemą pamatėme, kad LS slėgio ribojimo vožtuvas yra reguliuojamas, o tai galėjo reikšti, kad vožtuvas atsidaro per anksti ir praleidžia alyvą pro pagrindinę pakopą. Alyva sistemoje visada renkasi mažiausio pasipriešinimo kelią. Prijungtas Pico leido realiuoju laiku braižyti slėgio grafiką, kol reguliavome LS spyruoklę. Taip galėjome užtikrinti, kad neviršysime mašinos darbinio slėgio.
Užblokavus (deadhead) teleskopo funkciją, kad būtų reikalaujama srauto, LS slėgis padidėja, o šis savo ruožtu laiko pagrindinės pakopos slėgio ribojimo vožtuvą uždarytą. Lėtai reguliavome LS slėgio ribojimo vožtuvą, kol reguliavimo varžto nebebuvo galima pasukti toliau. Kaip matote, vis tiek turėjome tik 199,3 bar ir 69 l/min alyvos pro slėgio ribojimo vožtuvą.
Bet kaip beveik visa alyva gali grįžti pro vožtuvų bloką? LS slėgio ribojimo vožtuvo reguliavimo varžtas buvo įsuktas iki galo. Tai turėtų neleisti vožtuvui atsidaryti. Be to, užblokuotas hidraulinis cilindras neleidžia alyvai grįžti į baką per DCV. Tad kaip beveik visa alyva gali grįžti pro vožtuvų bloką?
Gal LS slėgio ribojimo vožtuvas negalėjo iki galo prisispausti prie lizdo ir, nepakankamai laikydamas uždarytą pagrindinę pakopą, praleido alyvą? O gal pagrindinės pakopos slėgio ribojimo vožtuvas buvo užstrigęs pusiau atidarytas?
Nusprendėme pakeisti išleidimo sekciją, tačiau tai anaiptol nėra lengva užduotis. Kai yra 15 vamzdžių ir hidroakumuliatorius, kuriame alyva laikoma 35 bar slėgiu, būtina visiškai suprasti, ką darai. Dirbant su hidraulika mokymai yra labai svarbūs, todėl prieš imdamiesi tokių sistemų būtinai įsitikinkite, kad turite tinkamų žinių ir supratimo. Ši atvejo analizė neturi būti naudojama kaip vadovas, kaip dirbti su hidraulika.
Pakeitėme išleidimo sekciją ir vožtuvų bloką sumontavome atgal. Įsitikinome, kad slėgio ribojimo vožtuvo reguliavimo varžtas yra iki galo
išsuktas
, kad nutekėjimo atveju sistemoje nesusidarytų slėgis. Paleidome mašiną ir patikrinome, ar nedega įspėjamosios lemputės. Viskas buvo gerai, nuotėkių nebuvo. Atėjo laikas pradėti reguliuoti LS slėgio ribojimo vožtuvą.
Reguliuodami vožtuvą po vieną apsisukimą matėme, kaip su kiekvienu pasukimu slėgis kyla. Tikrai jau turėjome įminti mįslę. Slėgis vis kilo: 100 bar, 180 bar…
200 bar! Tačiau tuo metu slėgio ribojimo vožtuvo reguliavimo varžto toliau pasukti nebegalėjau. Vėl pasiekiau reguliavimo ribą ir susidūrėme su ta pačia problema kaip ir su senąja išleidimo sekcija. Savaime suprantama, buvo daug nusivylimo ir dar daugiau galvos sukimo. Peržvelgę tai, ką jau žinojome: dabar neleidome LS slėgiui grįžti į baką, vadinasi, visas LS slėgis prisideda prie pagrindinės pakopos slėgio ribojimo. Vis dėlto siurblio slėgis pasiekia tik 200 bar esant 70 l/min srautui, o tai beveik visa turima alyva. Kaip alyva gali praeiti pro šį slėgio ribojimo vožtuvą? Dar kartą pažvelgę į schemą pamatėme kitus kelius atgal į baką, kurie nėjo per slėgio ribojimo vožtuvą.
Alyva galėjo keliauti keliais keliais: pro atramas (stabilizatorius), vairo mechanizmą, pasukimo variklį arba pro sklendę (spool) ir atgal į baką. Nusprendėme šias funkcijas užaklinti ir patikrinti, ar taip yra. Užaklinę jungtis galėjome pamatyti, ar tai pakeis slėgį, nes „pabėgančiai“ alyvai nebeliktų kur dingti. Deja, nepaisant viso to, slėgio virš 200 bar pakelti vis tiek nepavyko.
Pradėjo trūkti variantų. Vis labiau atrodė, kad alyva į baką grįžta kitu keliu, ne pro slėgio ribojimo vožtuvą. Viena mintis buvo iš išimtų sekcijų susikonstruoti savo vožtuvų bloką. Taip galėtume pridėti kryptinį valdymo vožtuvą (DCV), kad valdytume ir užblokuotume vieną funkciją. Padalijus sistemą tokiu būdu galima nustatyti, ar gedimas yra vienoje, ar kitoje vožtuvų bloko pusėje.
Schemą perpiešiau iš naujo ir pašalinau dalį vožtuvų bloko, kad išryškinčiau kelis svarbius dalykus. Svarbiausia atkreipti dėmesį į bako liniją, kuri veikia nepriklausomai nuo dviejų pakopų slėgio ribojimo vožtuvo. Mano paryškinta sekcija yra teleskopo funkcija, tai yra hidraulinis cilindras. Pro ją atgal į bako liniją (pažymėta mėlynai) didelis srautas neturėtų grįžti. Tačiau iki galo įsukus LS slėgio ribojimo vožtuvo reguliavimo varžtą, į baką vis tiek grįždavo 70 l/min. O jeigu kažkur vožtuvų bloko viduje yra vidinis nuotėkis tarp aukšto slėgio alyvos ir labai žemo grąžinimo į baką linijos slėgio? Ir, dar svarbiau, kaip tai įrodyti?
Laikas vėl mus nugalėjo, tad turėjome baigti darbą ir mašiną surinkti, kad klientas galėtų ja naudotis net ir esant gedimui. Nors buvome kiek nusiminę, kad vis dar nepavyko įvardyti konkretaus mazgo, PicoScope įrašymo ir duomenų išsaugojimo galimybės padėjo parodyti padarytą pažangą. Tai svarbu, nes įrodo atliktą darbą. Vis dėlto laikas yra pinigai, todėl kilo jausmas: „Kiek testavimo yra per daug?“.
4 diena
Šios dienos veiksmų planas žlugo dar jai neprasidėjus. Srautmatis, kurį naudojau, prireikė kitur, todėl tos dienos bandymų metu srauto matavimų užfiksuoti negalėjau. Negalėti matuoti srauto nebuvo idealu, bet buvome gana įsitikinę, kad alyva niekur kitur nedingsta, o grįžta į baką pro vožtuvų bloko išleidimo sekciją. Tikėdamiesi rasti kryptį, nusprendėme vožtuvų bloką padalyti pusiau. Tai reiškė vėl nuimti vožtuvų bloką ir galinę sekciją perkelti taip, kad ji atsidurtų tarp teleskopo sekcijos ir vietos, kur iš pradžių buvo pasukimo sekcija. Jei vidinis nuotėkis yra pro DCV sklendę arba tarp sekcijų, galbūt suprastume, kurioje pusėje slypi gedimas.
When attempting to start the vehicle, once started the engine would continue to run.
Quite often, the customer interview leads to a “probable” diagnosis and my line of thinking here was a mechanical engine timing issue, based on the lack of vehicle history, the high mileage, and the rattle from the engine at idle accompanied by popping via the intake.
In the Basic Inspection, we confirmed that there were no fluid leakages, no visible signs of damage to hoses, connections, and wiring harnesses and no sign of that favorite discovery; accident repair.
A vehicle scan of all onboard control units revealed only three fault codes stored within the Air conditioner ECU and none of them related to engine performance! Live engine data at idle speed did however reveal a fluctuating intake manifold pressure of 0.53 bar (absolute) which was no surprise given the unstable idle and intake popping.
Before diving deeper, we took a step back and checked for Technical Bulletins (Recalls & Campaigns etc.). This is paramount. The most efficient route to qualify the presence of “known issues and fixes” etc., is to use the manufacturer technical portal combined with the vehicle chassis number.
While this may seem obvious, there are a number of avenues to obtain free technical bulletins and “known fixes”! I have learned that while the entire description of such obtained data matches the exact symptom you are experiencing, the information obtained may well be for other markets i.e., not applicable to UK specification vehicles. (Please don’t fall into this trap as I have with previous vehicles).
Possible causes
• Contaminated or incorrect fuel supply
• Ignition and fuel timing control
• Mechanical engine timing error
• Valve train control error
The action plan
The action plan was predominantly governed by accessibility, probability and cost.
Contaminated or incorrect fuel was quickly eliminated with a fuel sample taken at the injector rail. Everything is checked out here.
Based on the acquired scan data, I was leaning away from ignition and timing control errors as the engine performance improved above 1500 rpm and no related fault codes had been stored.
A valve train control error was possible but required intrusion. Therefore, the focus was on the integrity of the engine’s mechanical timing.
Let’s recap:
1. Difficulty in starting the engine with labored cranking
2. Unstable idle speed
3. Failure to willingly free rev
4. Popping sound via the intake
5. Rattle from the engine at idle
Arguably, the least intrusive way to verify mechanical engine timing is to carry out a cam and crank correlation test as discussed here. This test will include dynamic timing errors caused by worn camshaft drive belts, idlers and chains, etc. The below waveform is quite complex and has a lot to digest. This is because I also introduced pressure pulse analysis with the Pico WPS500X pressure transducers.
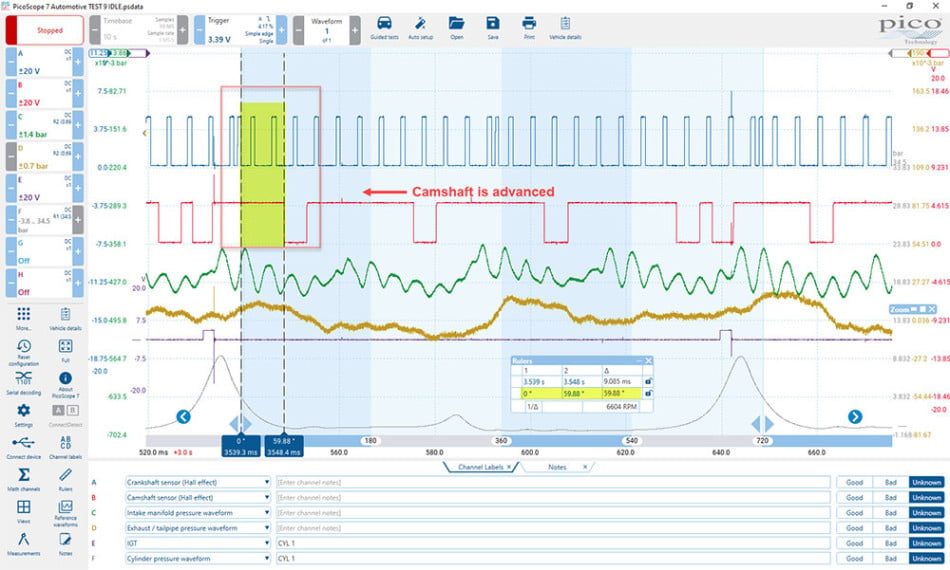
The first step in the analysis required focusing on the correlation between the crankshaft (Ch A) and the camshaft (Ch B) signals. Here, I had chosen the final falling edge of the crankshaft sensor engine position reference signal (two teeth in close proximity to one another) and the first falling edge of the camshaft sensor signal thereafter, which equated to 59.88° of crankshaft rotation or indeed, two teeth of the crankshaft pick-up.
The next step was to access the waveform library for a known good correlation capture as described here.
The waveform below is a known good comparison downloaded from the waveform library. Thanks to sennis201, wherever you are, for uploading and sharing this.
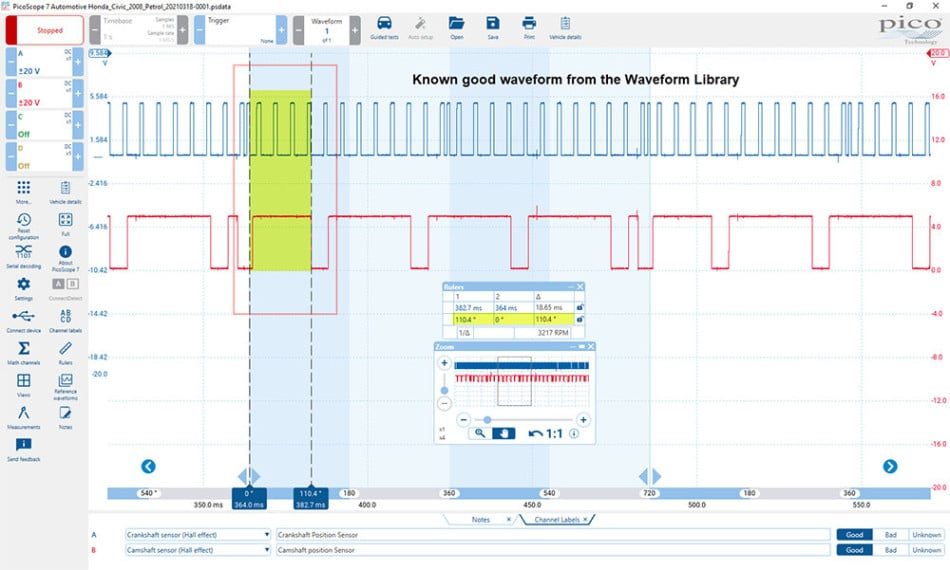
We used the same measurement points and could clearly see that the crank and cam correlation is different at 110.4° of crankshaft rotation or four teeth of the crankshaft pick-up. From this, we could now conclude that our camshaft timing was advanced!
Because I had included a pressure transducer into cylinder 1, the intake manifold, and the exhaust tailpipe, we could verify the above conclusion by looking at known events in the 4-stroke cycle.
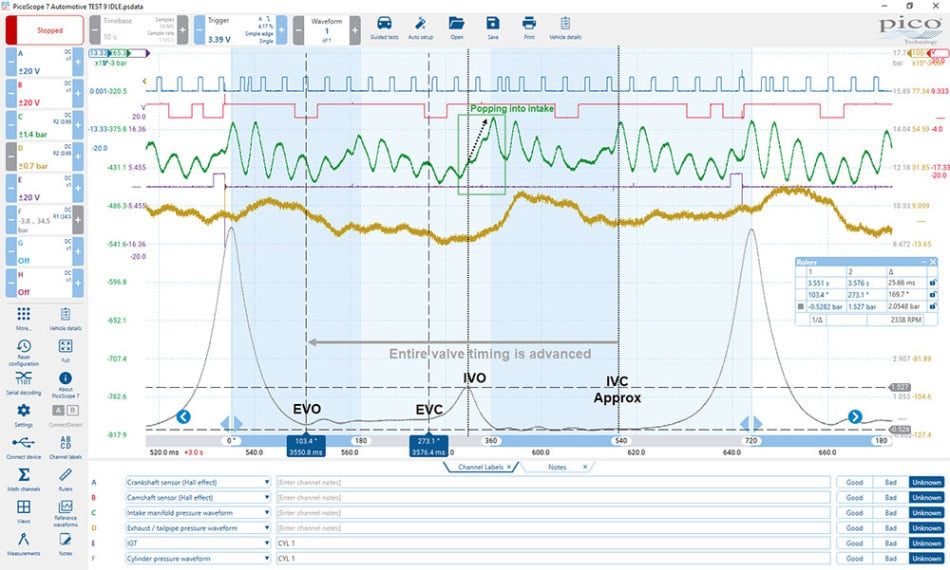
The waveform above shows the 4-stroke cycle exhibited by cylinder 1, leading to the following analysis:
• The exhaust valve open event (EVO) was advanced from the typical opening point of approx. 155° ATDC of the compression stroke
• The exhaust valve close event (EVC) was advanced from the typical closing point of approx. 365° ATDC of the compression stroke
• The inlet valve open event (IVO) was advanced from the typical opening point of approx. 355° ATDC of the compression stroke
• The inlet valve close event (IVC) was advanced from the typical closing point of approx. 620° ATDC of the compression stroke (hugely variable depending on engine design and VVT)
• The popping noise via the intake was caused by the 1.5 bar pressure held in the combustion chamber due to the advanced closing of the exhaust valve. Therefore, when the intake valve opened the pressure would escape back into the intake manifold
• Our fault condition was affecting all valves on cylinder 1
There was most certainly enough evidence to remove the timing cover and inspect the mechanical valve timing of this single overhead camshaft, chain-driven engine. However, could we apply another non-intrusive technique, using NVH, to link the rattling noise emitted from the engine to our valve timing error?
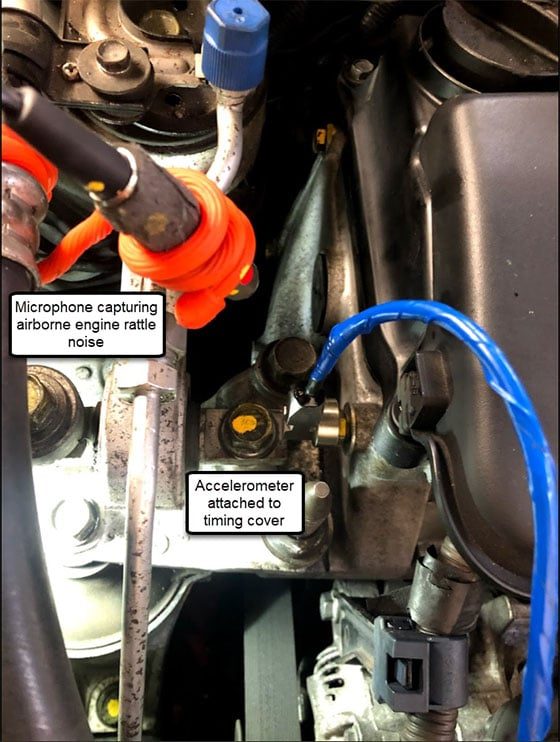
In the image below, you can see the setup where we used an NVH microphone and accelerometer to capture a recording of the vehicle when starting and running at approx. 1000 rpm (the engine was too unstable to run at idle). The microphone captured the airborne noise generated by the engine while the accelerometer captured the structure-borne vibration and noise from inside the timing cover.
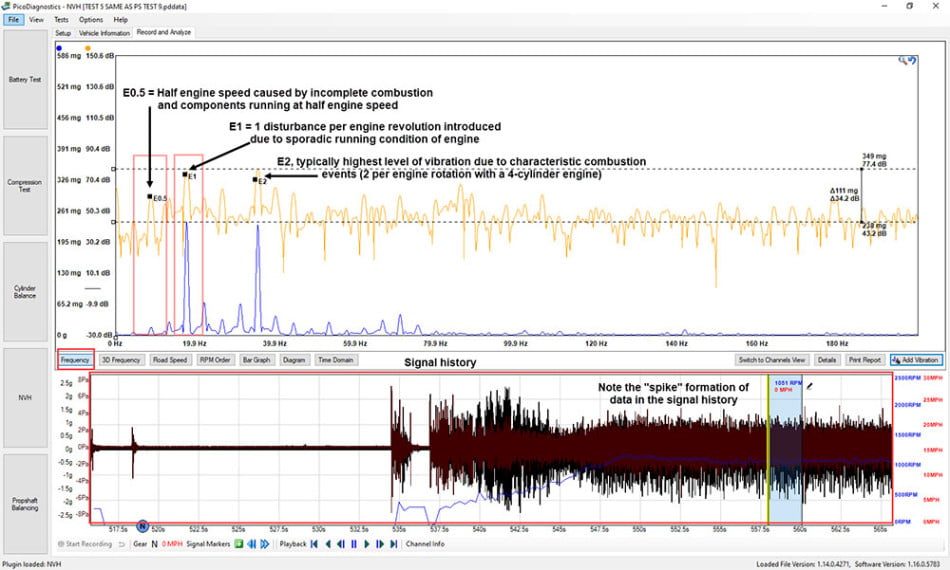
In the screenshot above, note the “spike” formation of the data in the signal history. This indicated instantaneous high energy peaks present for a very short period of time. Consider these spikes as momentary “strikes” attributed to combustion.
N.B. The audio recording at the start of this case study was taken from this NVH file using the audio export feature discussed here.
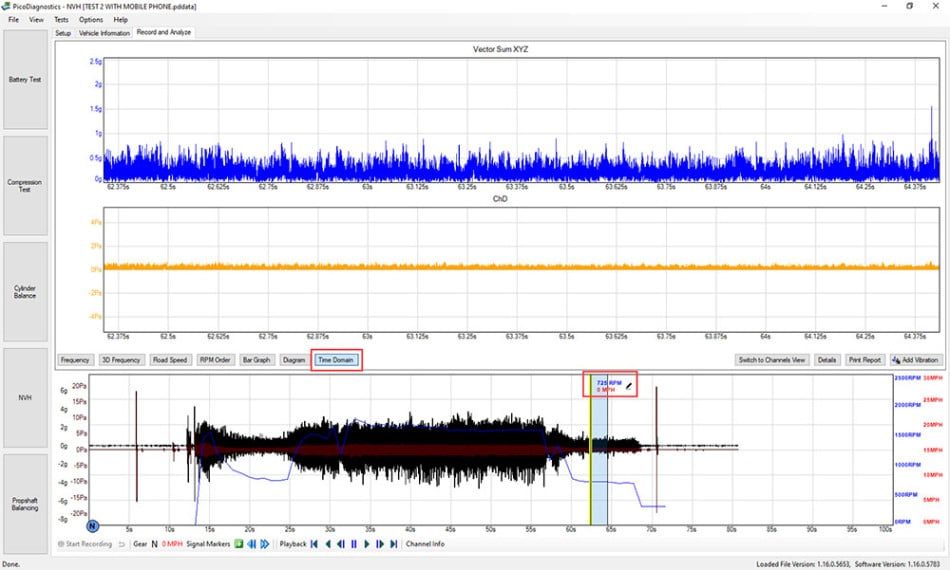
We can view these “strike” events with improved resolution in the NVH Time Domain view below. The accelerometer has captured approximately 18 periodic strikes in 1 second which equates to a first-order engine vibration at E1 (18 Hz x 60 = 1080 rpm).
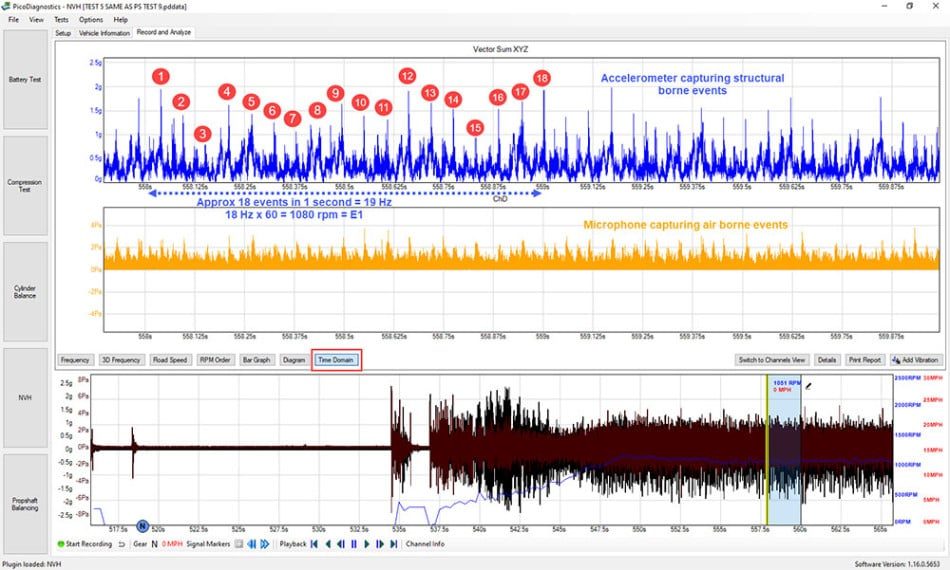
At this stage, we have captured the noise and vibration “signature” from our engine in order to qualify any improvements should authorisation be given for a repair. Now as bad luck would have it, moments after the above NVH recording was captured the engine cut out accompanied with an awful metallic sound from the cylinder head!
The NVH capture below is what to expect when cranking an engine with no compression as a result of contact between the inlet valves and the piston!
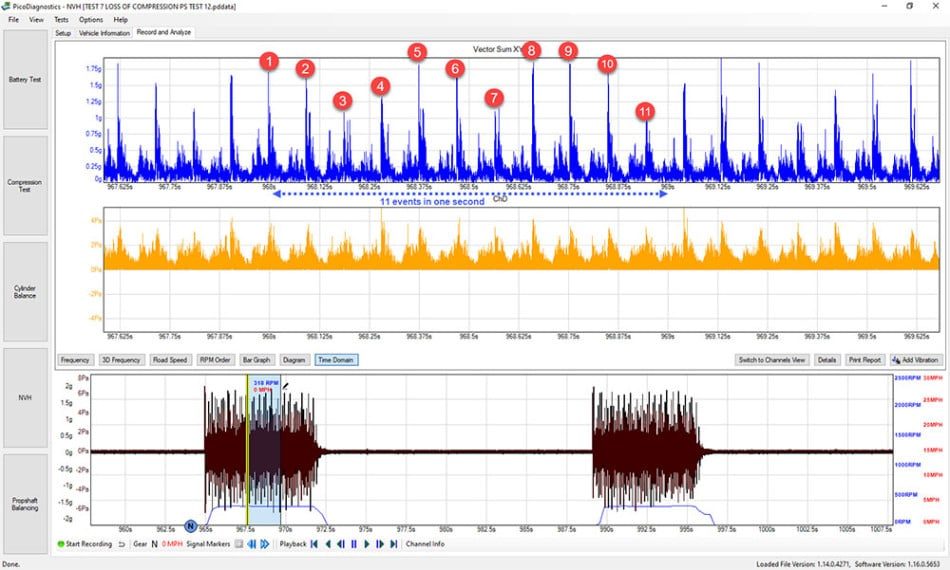
Note the higher-than-normal cranking speed at 318 rpm (318 / 60 = 5.3 Hz) and 11 strike events per second (11 Hz) 11 x 60 = 660 rpm. These periodic strike events are caused by contact between components at the rate of twice per engine revolution (2 x 5.3 Hz) and may well be a foul condition between the pistons and the deformed inlet valves or “flapping” of a worn timing chain.
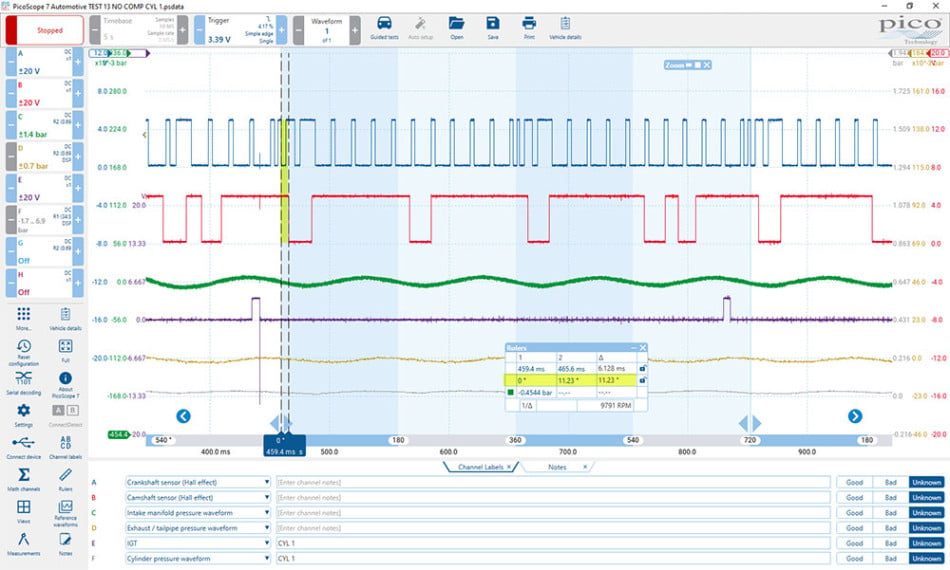
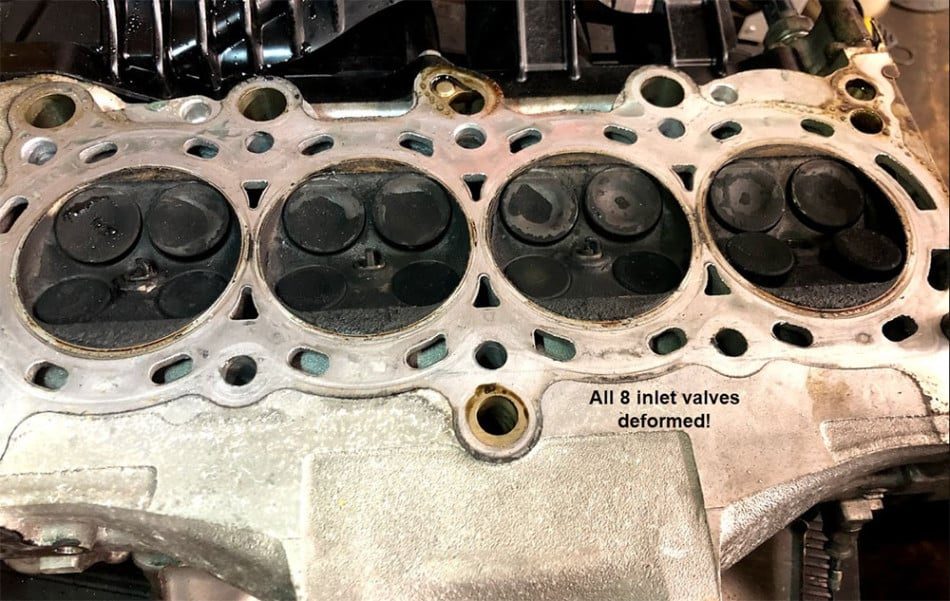
Needless to say, it was worth a look below to discover how far our valve timing had shifted to cause the catastrophic damage indicated above. Note that the cam and crank correlation has now advanced to 11.23° or indeed a tooth count of zero from our known good capture of 110.4° which equates to an advanced valve timing of 110.4 – 11.23 = 99.17° (crankshaft rotation) / 2 = 49.6° of camshaft deviation (I think this explains the piston to valve collision).
N.B note the lack of compression from cylinder 1 on channel F too!
Onwards and upwards! We got permission to investigate further and dismantled the engine which confirmed the inevitable.
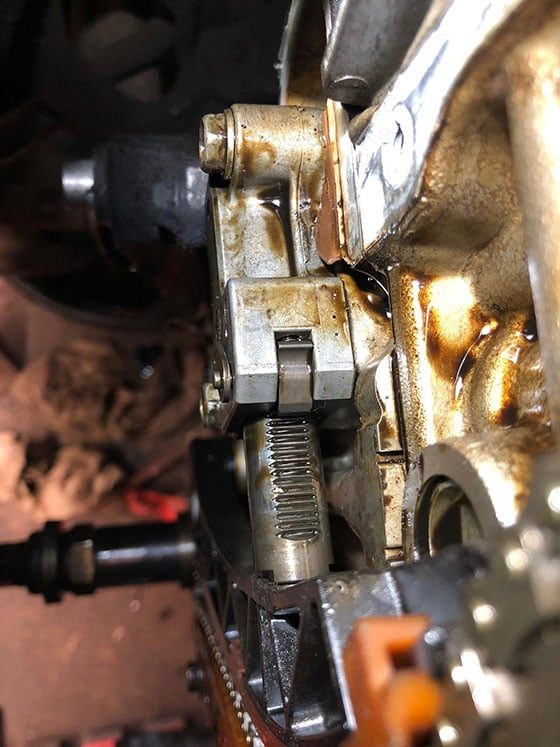
Note the timing chain tensioner “travel” and the wear to the chain slipper/guide:
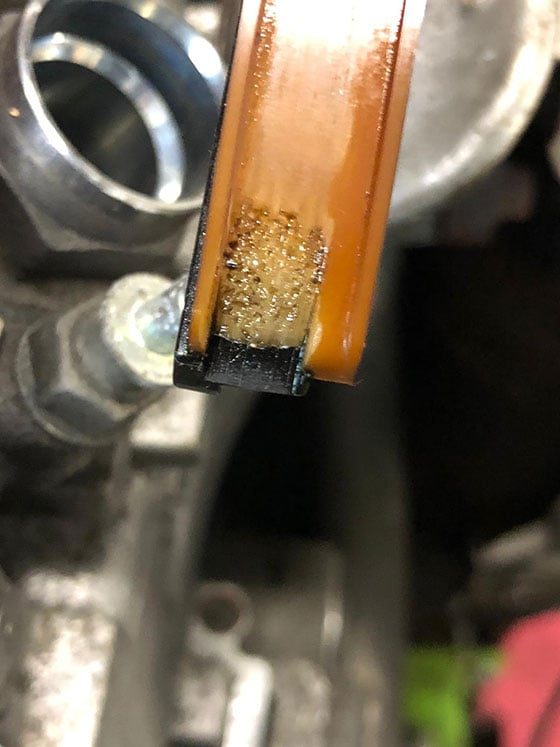
Also, note the unique wear pattern (contact) between the camshaft timing gear and timing chain:
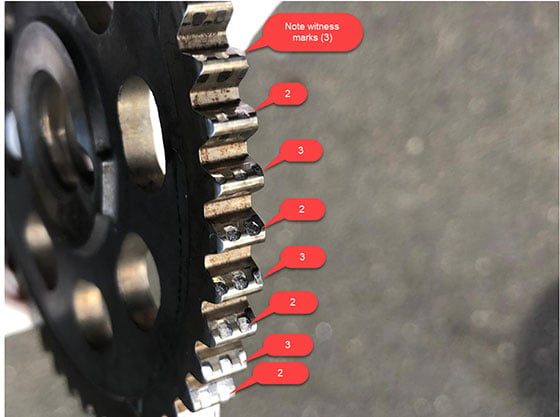
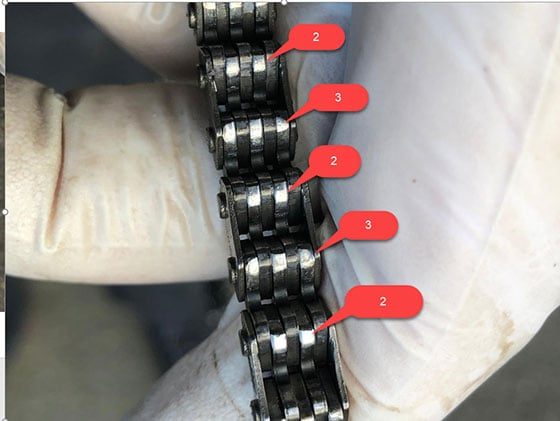
These are the witness marks on the links of the timing chain seen through a microscope:
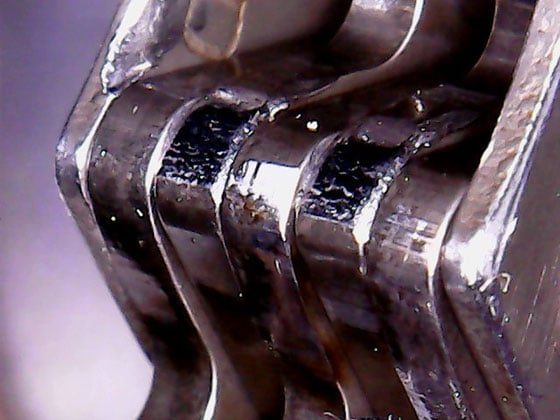
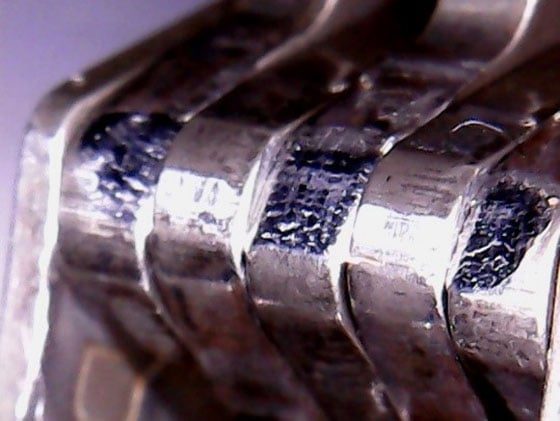
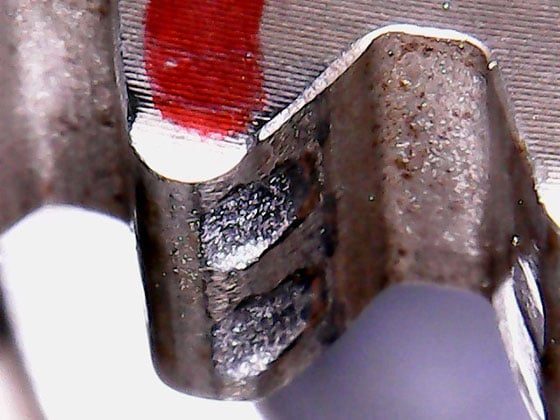
These are the witness marks on the teeth of the camshaft timing gear:
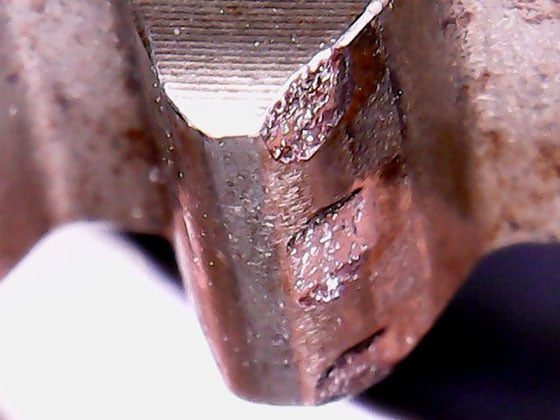
Finally, we took a look at just how far our chain had stretched by comparing the worn original chain with a new replacement below.
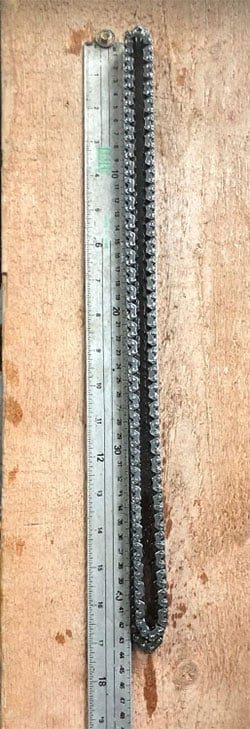
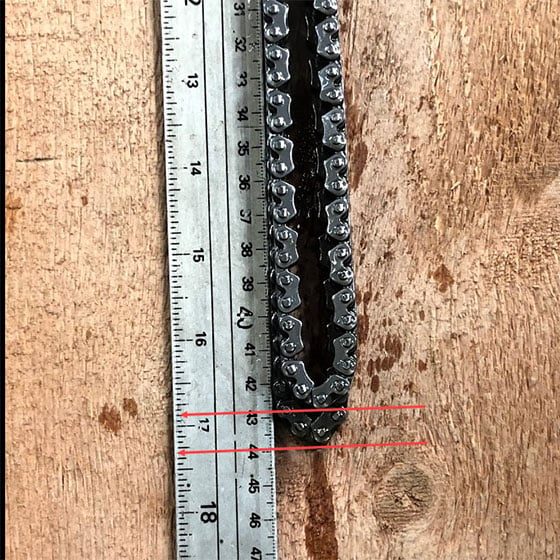
As you can see it had stretched roughly 1.2 cm.
Results / Confirmation of repair
We replaced all the relevant parts, the engine was reassembled and we proceeded to take the following captures to verify the repair.
Starting with cam and crank correlation at idle, acceleration and deceleration.
Here we evaluate the “push pull” effect of the crankshaft on the timing chain assembly by comparing correlation values.
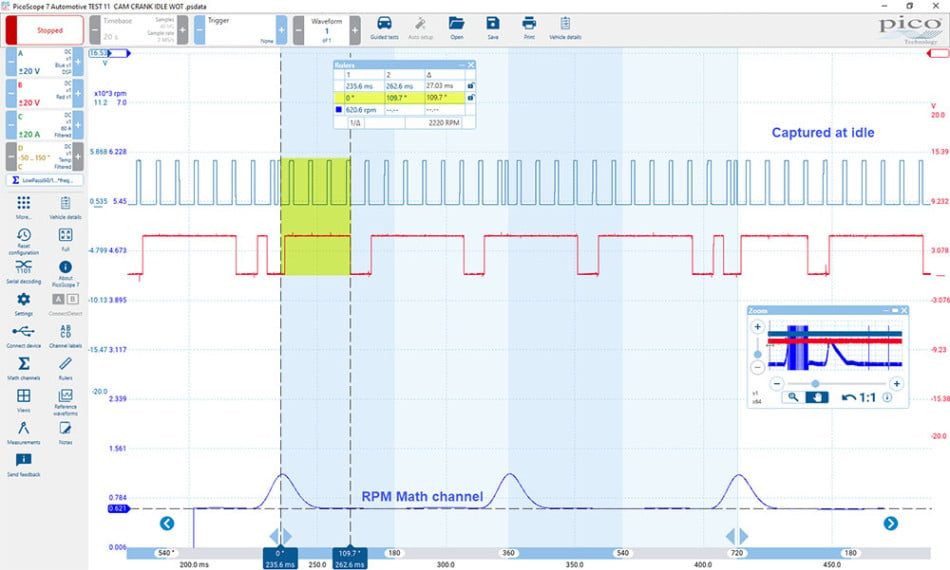
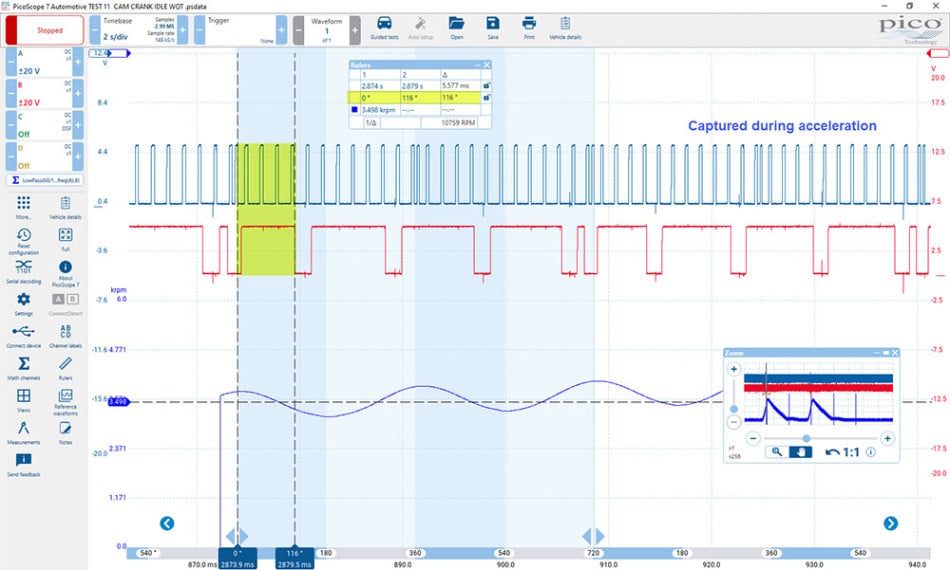
In the following screenshot, we captured the cam and crank correlation at 3500 rpm during crankshaft acceleration.
Correlation deviation: 116 – 109.7 = 6.3° (crankshaft rotation) / 2 = 3.15° of camshaft deviation!
This raised an eyebrow for sure as this deviation seems excessive based on this discussion where we concluded that 3° of camshaft deviation is sufficient to generate a correlation code! Of course, this depends on the vehicle manufacturer and the engine design. This engine does not utilise a camshaft phaser between the timing gear and camshaft (the relationship is fixed) and therefore the deviation should be minimal.
The variable valve control is carried out by using oil pressure to variate the camshaft profiles and not the cam and crank phase! Food for thought once again, and no doubt worthy of further discussion.
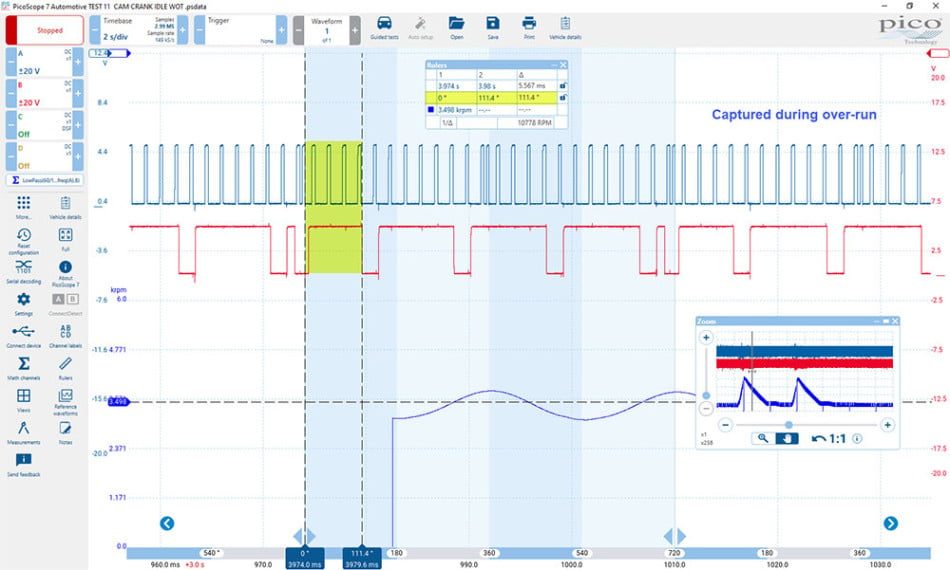
In the screenshot below, we captured the cam and crank correlation at 3500 rpm during crankshaft deceleration/over-run.
Correlation deviation: 111.4 – 109.7 = 1.7° ° (crankshaft rotation) / 2 = 0.85° of camshaft deviation.
Postfix in-cylinder analysis
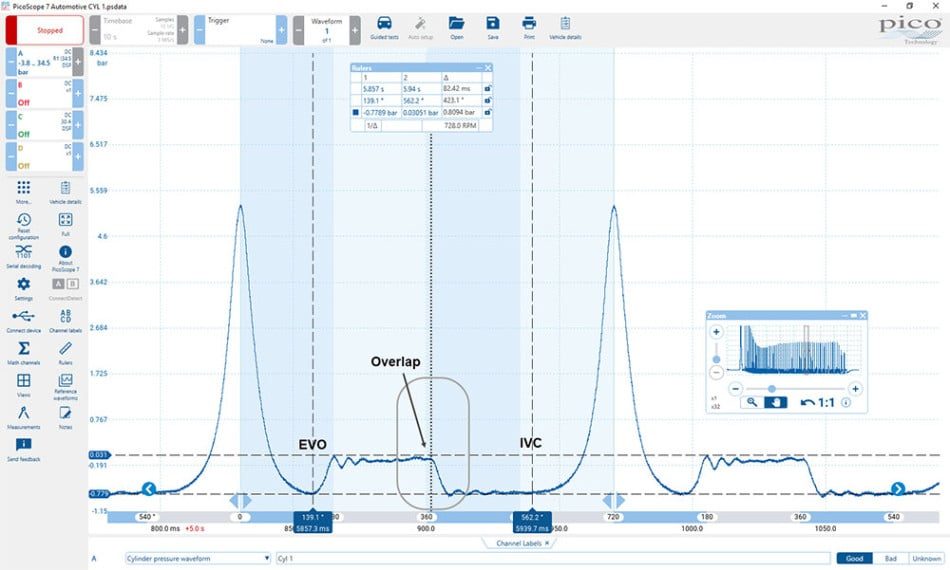
Below we had cylinder 1 captured during stable idle after start-up. Note the typical 4-stroke cycle waveform with clearly defined EVO at approx. 140° ATDC of the compression stroke (before fix 103°) and IVC at approx. 562° ATDC of the compression stroke (before fix approx. 540°). While it is difficult to categorically establish EVC and IVO (accompanied by the change of direction of the piston during overlap), we can see these typical events occurring around the 360° ATDC of the compression stroke (before the fix these events were clearly visible before the 360° due to the advanced valve timing).
NVH analysis
Below we have the post-fix data (frequency view) at stable idle speed, captured by the microphone and accelerometer installed in identical locations to the initial captures earlier in this case.
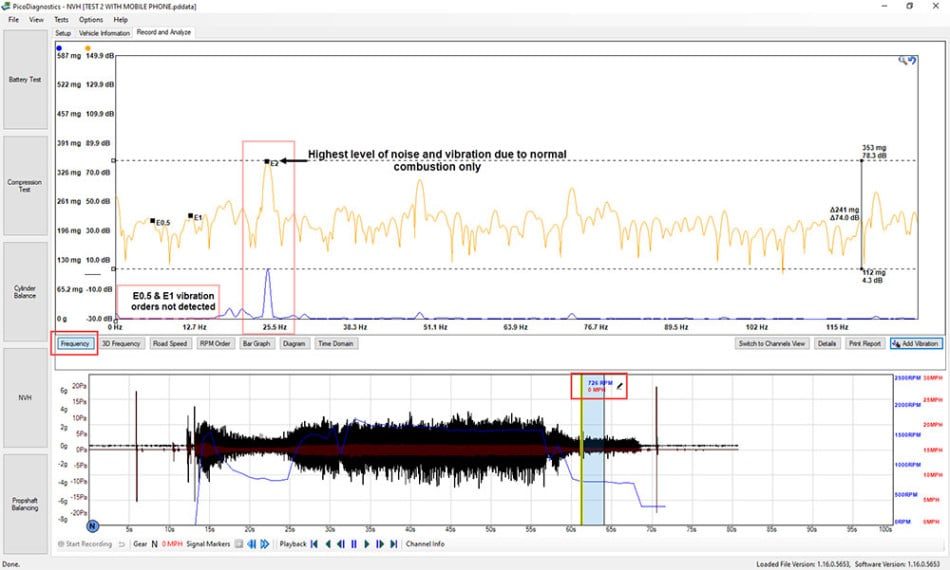
Note how the previous vibration orders E0.5 and E1 were no longer detected by the accelerometer now that complete combustion and chain tension had been restored. Our normal E2 vibration order was now measured at 112 mg via the accelerometer (before fix 238 mg).
Now let’s take a look at the time domain below. The difference between pre and postfix is like night and day with the near absence of intense “strike” events.
At this stage of post-fix analysis, I would like to include a mobile phone recording as we have discussed here.
Please listen to both recordings below which were taken simultaneously (in front of the timing cover) one using an NVH mic and the other using a mobile phone
The following audio file was taken from the above NVH capture using the microphone on Channel D:
The following audio recording is the same as the one above but captured using a mobile phone
Notice that there is a clear difference in the perceived clarity between the recordings, given the mobile phone is optimized for a specified range of frequencies, incorporates a degree of noise-canceling, has directional qualities and in some cases, utilizes multiple microphones. The noises therefore captured by mobile phones have a degree of “enhancement” which you can hear in the mobile phone recording above between 18-22 seconds where there appears to be loud tappet-style noise that is not so prominent to the human ear or indeed in the NVH recording. While mobile phones are incredibly useful and readily available, I would not base a diagnosis on a smartphone recording alone.
Additional sound analysis software
When using the PicoDiagnostics NVH software, you may wish to expand on the analysis of sounds using additional free software such as Audacity or Sonic Visualizer which we have discussed here and here.
Looking back at our initial NVH capture taken before the fix, we have exported the sound from channel A (accelerometer attached to the timing cover) and imported this data into Sonic Visualizer where we have additional analysis features at our disposal.
The image below has our exported data from the time domain of PicoScope NVH (blue waveform/engine speed 1080 rpm) with the addition of a Melodic Spectrogram (Heat Map) which is optimized for melodic content.
Note how frequency is now on the Y-axis, time on the X-axis and the energy level (amplitude) of the sound is displayed using colors. (Brighter colors = higher energy/amplitude.)
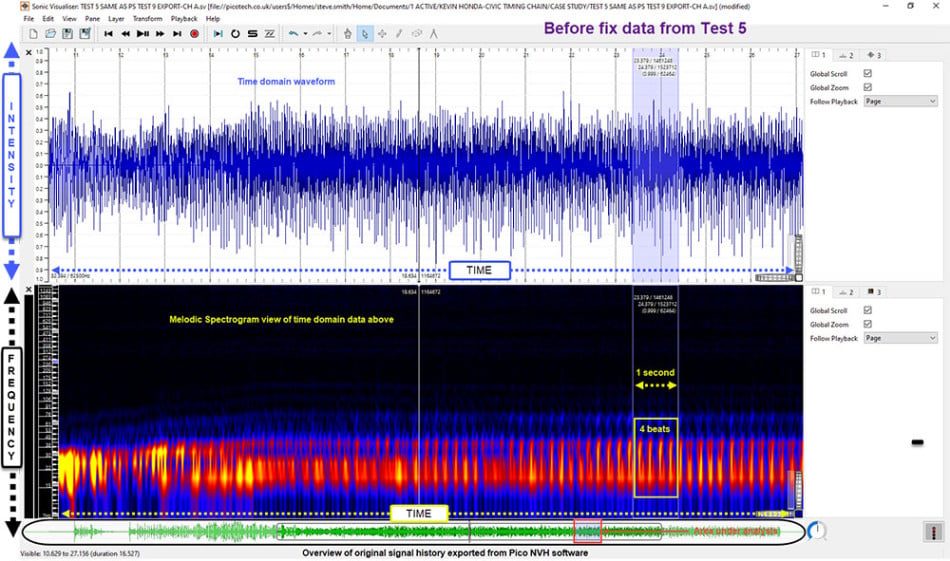
In the screenshot above, we can clearly see the bright red and yellow “strikes” displayed at a rate of four beats per second (4 Hz) The use of bright colors indicates that these beats contain sufficient energy levels to be distinguished from all other sounds within the recording (the most dominant sound level).
Given that these beats are detected by the accelerometer attached to the timing cover (similar to a stethoscope) we have further evidence that these intensive, periodic energy beats are characteristic of a strike or contact between components which I suspect are the tensioner guide and timing chain (see below).
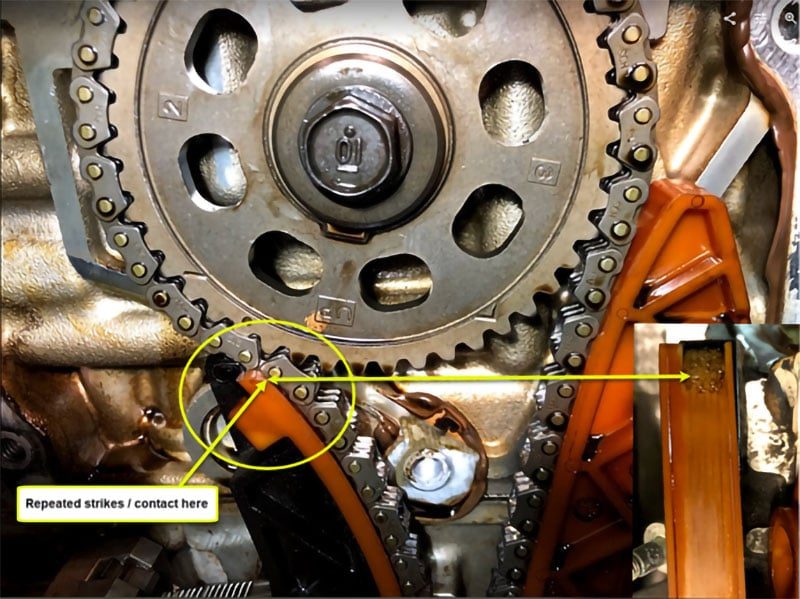
The relationship of the beat frequency (4 Hz) to our engine frequency at 1080 rpm /18 Hz is not easily defined because the timing chain/tensioner will be responding to incomplete combustion events every revolution of the engine. This will create a “whip” in the chain which no doubt will introduce a unique vibration characteristic.
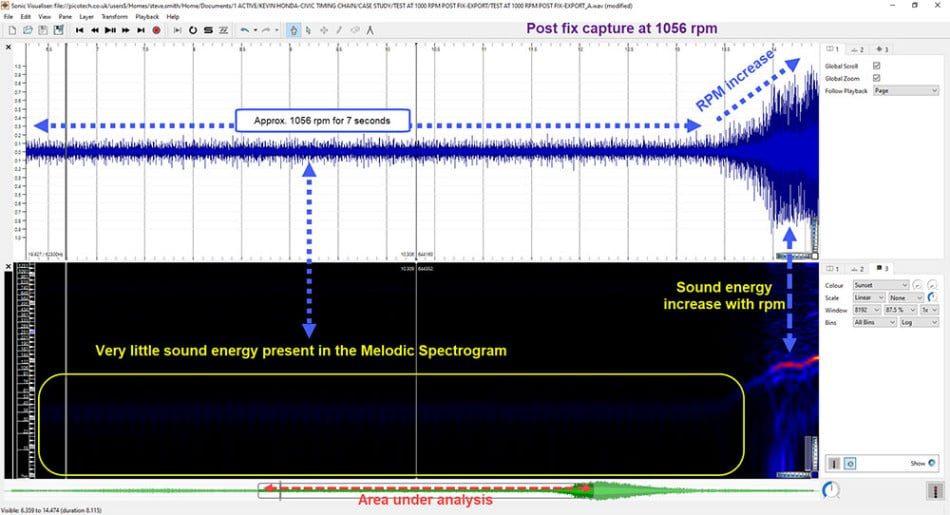
Below we have a postfix capture where the results speak for themselves with very little sound energy to display until the engine was free-revved towards the end of the capture.
List All Parts Fitted
A timing chain kit, a used camshaft with eight used inlet valves, and all associated gaskets/consumables.
Additional comments
With all diagnoses, there has to be a logical procedure to follow that includes various levels of diagnostic intrusion accompanied by costs. (The more intrusion the more cost) There is no doubt that the case study above is quite unique, given we were able to capture data prior to engine failure which most would have diagnosed without lifting the bonnet. With that said, the least intrusive of all the techniques above was our NVH measurement, which could be applied during routine servicing in order to build an engine/vehicle NVH signature. This could in turn allow for early warning of such catastrophic failures.
I wish to say thanks to Kevin Ives at Ives Garage for his support throughout the above case study, which spanned from October 2019 to March 2021 (That was a lot of coffee and cake.)
Straipsnis išverstas iš Pico Technology bibliotekos su gamintojo leidimu. PicoScope įrangą rasite mūsų kataloge.